.svg)

Financial statement analysis is the process of evaluating a company’s financial health, operational performance, and growth potential by examining its key financial reports. It is not only a tool for accountants and investors but also an essential framework that helps business owners make informed and timely decisions.
In practice, however, many business owners tend to focus on familiar metrics such as revenue, profit, or the cash balance in their bank accounts. While important, these figures provide only a partial view of the company’s financial position. A business may report strong revenue growth while struggling to meet its short-term obligations. Conversely, a company may hold substantial cash reserves but still fail to use its capital efficiently.
For this reason, monitoring individual financial metrics in isolation is not enough to accurately assess business performance. To understand whether a company is operating effectively, capable of sustainable growth, and prepared for potential risks, a comprehensive financial statement analysis is essential.
1. What is Financial Statement Analysis?
According to the Corporate Finance Institute (CFI), a leading provider of finance and business certifications, Financial Statement Analysis is the process of evaluating a company's financial health and performance by examining its key financial statements, including the Profit & Loss Statement (P&L), Balance Sheet, and Cash Flow Statement. This process transforms accounting data into meaningful insights that support business decision-making and long-term strategic planning.
By analyzing financial data, businesses can assess profitability, liquidity, financial stability, and the efficiency of asset and capital utilization. Financial statement analysis also provides investors, banks, business partners, and other stakeholders with a clearer understanding of a company's financial condition before making investment or partnership decisions.
2. Why is Financial Statement Analysis Important?
Financial statements are more than just a collection of accounting figures prepared at the end of a month or fiscal year. Each report contains valuable information that reflects the actual performance and financial position of a business. However, individual numbers rarely tell the full story on their own. Financial data only becomes truly meaningful when it is analyzed and evaluated in relation to other financial metrics.
For example, a company may report strong profits during a particular period while facing cash flow shortages that make it difficult to pay suppliers or cover operating expenses. In such cases, relying solely on profit figures can lead to an inaccurate assessment of the company's financial health. On the other hand, a business with a relatively high level of debt may not necessarily be in financial distress if it maintains strong repayment capacity and uses borrowed capital effectively to generate returns.
Financial statement analysis helps businesses gain a deeper understanding of these situations. Rather than simply knowing how much revenue or profit the company generates, management can identify the factors driving performance, evaluate the quality of growth, and detect potential financial risks before they become significant problems.
For investors, financial statement analysis is often the first step in evaluating a company. Before committing capital, investors typically want to understand whether the business generates sustainable profits, maintains healthy cash flows, manages debt effectively, and possesses strong long-term growth potential. Financial statement analysis provides the insights needed to answer these critical questions.
In addition, regular financial analysis helps businesses strengthen corporate governance, improve financial transparency, and ensure compliance with accounting, tax, and financial reporting requirements. As a result, it plays a vital role not only in measuring business performance but also in supporting sustainable growth and informed decision-making.
3. Objectives of Financial Statement Analysis
According to the Corporate Finance Institute (CFI), a leading provider of finance and business certifications, the primary objective of financial statement analysis is to evaluate a company’s operational performance and financial health over time. This process goes beyond reviewing financial figures at a single point in time. It enables businesses to identify growth or decline trends by comparing financial data across different periods.
In addition, companies can use the results of financial statement analysis to benchmark their performance against competitors within the same industry. Comparing financial performance against industry standards helps businesses understand their current market position and identify areas that require improvement to strengthen their competitive advantage.
For finance and accounting teams, financial statement analysis also serves as the foundation for building financial forecasting models. By analyzing historical performance, businesses can project future revenue, expenses, profitability, and cash flow. This allows management to take a more proactive approach to budgeting, working capital management, and resource allocation in support of long-term growth objectives.
3.1 Profit & Loss Statement Analysis: Is the Business Truly Generating Profit?
When conducting financial statement analysis, most businesses begin with the Profit & Loss Statement, as it provides a clear picture of the company's ability to generate revenue and profit over a specific period.
Through income statement analysis, businesses can answer important questions such as whether revenue is growing or declining, whether profit margins are improving, and whether expenses are being managed efficiently or increasing faster than revenue growth.
One commonly used method is Vertical Analysis. This approach evaluates the cost structure of a business by expressing each line item on the income statement as a percentage of revenue. As a result, companies can clearly identify the proportion of Cost of Goods Sold (COGS), selling expenses, administrative expenses, interest expenses, and net profit relative to total revenue.
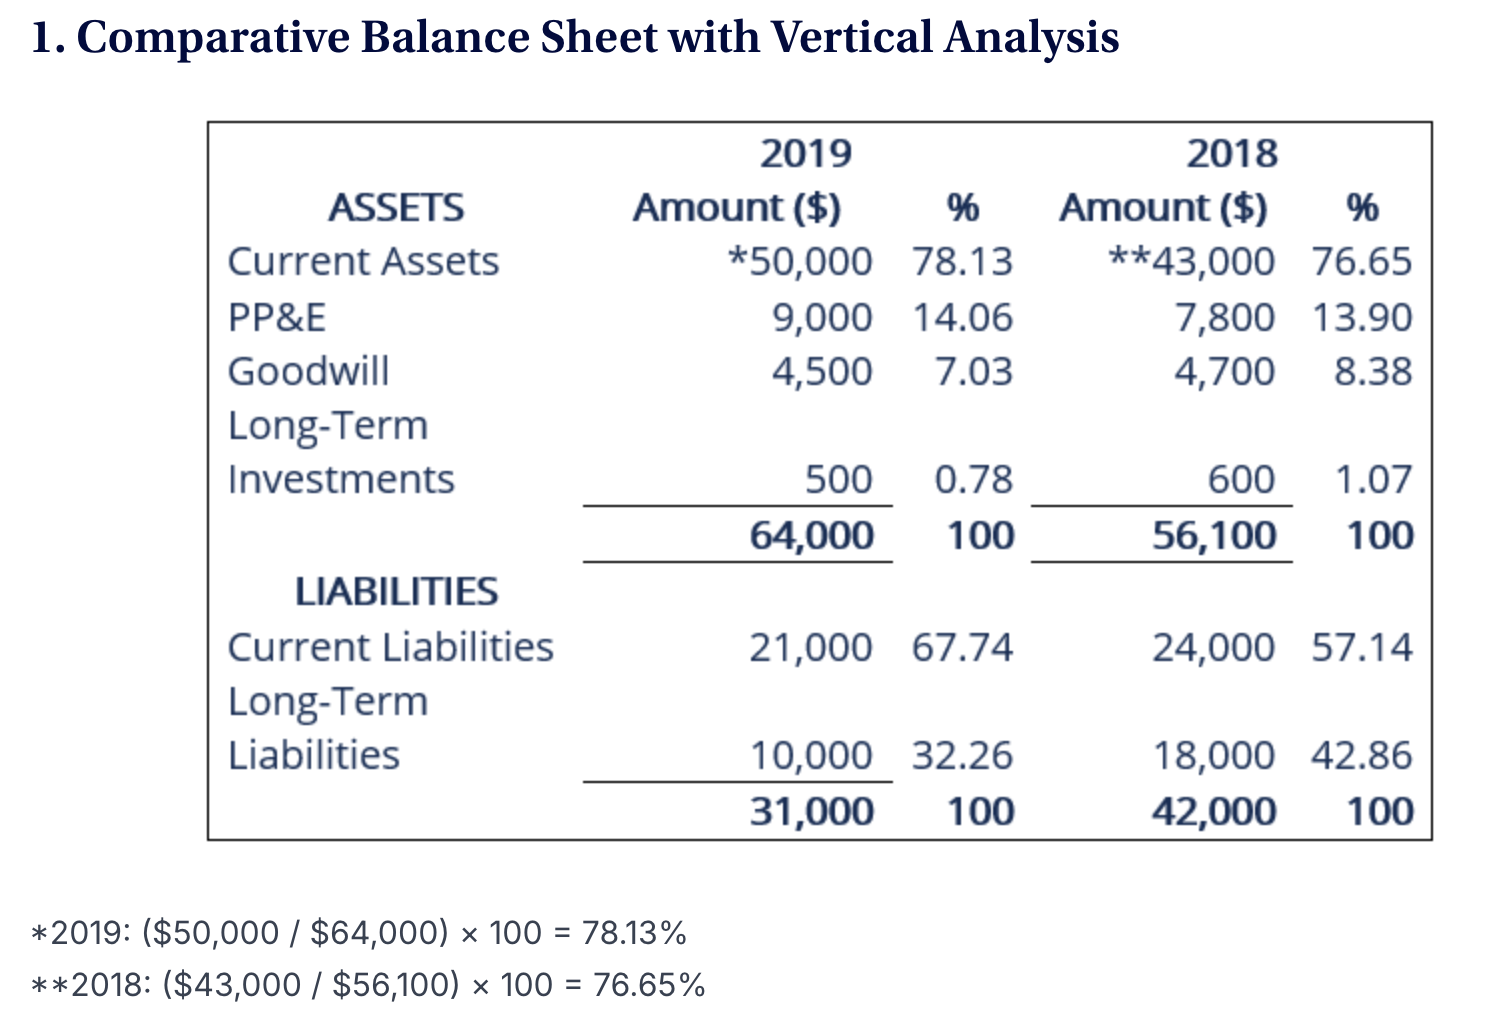
Another widely used method is Horizontal Analysis, which helps businesses measure the growth or decline of financial metrics over time. Rather than simply knowing the amount of revenue generated in a given year, companies can understand the rate at which revenue is growing, determine whether expenses are increasing faster than sales, and assess whether profitability is genuinely improving or merely influenced by short-term factors.

To illustrate how horizontal analysis works, consider an investor who wants to evaluate Company ABC’s financial performance before making an investment decision.
Assume that in the base year, Company ABC reported a net income of $15 million and retained earnings of $65 million. In the current year, the company reported a net income of $25 million and retained earnings of $67 million.
Based on these figures, Company ABC increased its net income by $10 million and its retained earnings by $2 million over the year. The growth rate of net income can be calculated as follows:
[($25 million – $15 million) / $15 million] x 100 = 66%
On the other hand, the company’s retained earnings grew by:
[($67 million – $65 million) / $65 million] x 100 = 3.07%
Together, these analytical approaches provide valuable insights into the drivers of profitability and help businesses evaluate the quality and sustainability of their growth.
3.2 Balance Sheet Analysis: What Does the Business Own and Owe?
While the Profit & Loss Statement (P&L) shows whether a business is generating a profit over a specific period, the Balance Sheet provides a snapshot of what the company owns and what it owes at a particular point in time.
The Balance Sheet reflects the three most important components of a company’s financial position: Assets, Liabilities, and Equity. By analyzing this report, businesses can assess their financial stability, debt repayment capacity, and how effectively they are utilizing available resources.
One of the key areas of Balance Sheet analysis is evaluating short-term liquidity. Metrics such as the Current Ratio and Quick Ratio help businesses determine whether their current assets are sufficient to cover short-term obligations as they come due. This is particularly important for fast-growing companies that require substantial working capital to support daily operations.
In addition, businesses should monitor their use of borrowed capital through leverage ratios such as the Debt-to-Equity Ratio and Debt-to-EBITDA Ratio. These metrics provide insights into the extent to which a company relies on debt financing and its ability to meet future debt obligations.
Beyond assessing liquidity and capital structure, the Balance Sheet also helps businesses evaluate how efficiently their assets are being managed. Metrics such as Inventory Turnover , Total Asset Turnover and Accounts Receivable Days indicate how effectively the company is using its assets to generate revenue. If inventory moves slowly or receivables take too long to be collected, cash flow may be negatively impacted even when the business continues to report revenue and profits. Regularly monitoring these metrics enables companies to identify operational bottlenecks early and implement improvements that enhance overall business performance.
3.3 Cash Flow Statement Analysis: Is the Business Actually Retaining Cash?
One of the most common misconceptions in financial management is the belief that a profitable business automatically has strong cash reserves. In reality, profit and cash flow are two very different concepts. A company may report healthy profits on its financial statements while still struggling to pay operating expenses, employee salaries, or suppliers.
This is because profit is recorded based on accounting principles and revenue recognition rules, whereas cash flow reflects the actual movement of cash into and out of the business. For example, a company may recognize revenue from a sale even though payment has not yet been received from the customer. Likewise, a business may invest a significant amount of cash in inventory to support future growth. In both situations, profit may increase while actual cash on hand remains unchanged or even decreases.
This is why the Cash Flow Statement is considered one of the most important financial reports within a company’s financial reporting system. It provides a clear picture of where cash is coming from, how it is being used, and how much cash remains available after a given reporting period.
Typically, the Cash Flow Statement is divided into three primary categories.
-
Cash Flow from Operating Activities, which reflects cash generated from core business operations such as selling products, providing services, and covering day-to-day operating expenses.
-
Cash Flow from Investing Activities, which includes cash used for purchasing assets, investing in equipment, technology, or other long-term investments.
-
Cash Flow from Financing Activities, which records activities such as borrowing funds, repaying debt, raising capital, or distributing dividends to shareholders.
Analyzing the Cash Flow Statement helps businesses understand their ability to generate cash from core operations rather than relying solely on accounting profits. It also enables management to assess future financing needs, monitor investment activities, and ensure sufficient liquidity to support ongoing operations. For investors and financial professionals, cash flow is often regarded as the most reliable indicator of a company’s financial quality and operational performance, as the ability to generate cash ultimately determines long-term sustainability and growth potential.
4. Profitability Analysis: What Drives Financial Performance?
After analyzing the Profit & Loss Statement (P&L), Balance Sheet, and Cash Flow Statement, a business gains a comprehensive understanding of its revenue, profitability, assets, capital structure, and cash flow. However, to truly understand what drives financial performance, companies need to take one step further by connecting data from all three financial statements and evaluating it through key financial ratios.
At this stage, the objective is no longer simply determining whether the business is profitable or not. Instead, the focus shifts to understanding the factors behind those results. Companies need to identify whether profit growth is being driven by increasing revenue, improved cost control, or more efficient use of existing capital. These insights are essential for helping management make informed strategic decisions and allocate resources more effectively.
Some of the most commonly used performance metrics include Return on Equity (ROE), Return on Assets (ROA), Gross Profit Margin, and Net Profit Margin. These indicators measure how effectively a business generates profits from shareholders’ equity, company assets, and revenue. By analyzing these ratios, businesses can assess how efficiently they are utilizing resources to create value.
To gain a deeper understanding of the factors influencing financial performance, many companies and finance professionals use the DuPont Analysis framework. Rather than viewing ROE as a single performance metric, DuPont Analysis breaks ROE down into multiple components to identify the true sources of financial performance. This allows businesses to determine whether a strong ROE is driven by high profitability, efficient asset utilization, or the use of financial leverage through debt financing.
For example, two companies may both report an ROE of 20%, but the reasons behind their performance can be entirely different. One company may achieve a high ROE through strong profit margins and efficient operations, while another may rely heavily on debt to amplify returns. Understanding the underlying drivers of financial ratios enables businesses to evaluate the quality of their growth and assess whether their performance is sustainable over the long term.
By analyzing profitability ratios and the relationships between key financial metrics, management can identify which factors are contributing positively to business performance and which areas require improvement. This analysis also provides a solid foundation for developing long-term growth strategies, optimizing resource allocation, and strengthening the company’s competitive position in the market.
5. Turning Financial Data into Better Business Decisions
In today’s increasingly competitive business environment, simply having financial statements is no longer enough. What truly matters is a company’s ability to understand, analyze, and transform financial data into sound business decisions. This is why financial statement analysis is no longer solely the responsibility of the accounting or finance department—it has become an essential component of effective business management.
When conducted properly, financial statement analysis provides businesses with a comprehensive view of their operational performance, profitability, asset position, capital structure, and cash flow health. Rather than focusing solely on revenue or profit figures, companies can gain a deeper understanding of the factors driving financial results, accurately evaluate operational efficiency, and identify potential risks before they affect future growth.
In addition, regularly monitoring and analyzing financial metrics enables businesses to take a more proactive approach to cash flow management, cost optimization, growth planning, and long-term resource allocation. It provides a strong foundation for making data-driven decisions instead of relying on assumptions or intuition, ultimately improving management effectiveness and enhancing competitiveness.
At Sliner, we understand that many businesses, particularly small and medium-sized enterprises (SMEs), face challenges in building robust financial management systems or lack the internal resources required for in-depth financial analysis. That is why, beyond accounting, tax, and compliance services, Sliner works closely with businesses to establish management reporting systems, analyze business performance, monitor cash flow, develop budgets, and deliver intuitive financial reports that help leadership teams gain clear visibility into company performance.
By combining accounting and financial expertise with modern management technology, Sliner helps businesses transform financial data into actionable insights, enabling faster, more accurate, and more effective decision-making.
The three core financial statements—the Profit & Loss Statement (P&L), Balance Sheet, and Cash Flow Statement—are far more than tools for accounting and regulatory compliance. When properly monitored and analyzed, they become a foundation for understanding business performance, strengthening financial management, and building sustainable long-term growth strategies. This is the goal Sliner strives to achieve as a trusted partner supporting businesses on their journey toward stronger financial management and sustainable business growth.